Data Distribution
Overview
The Data Distribution widget provides a visual representation of how values are distributed within a selected column of a dataset. It helps users understand the frequency, percentage share, and presence of null values for individual column values. This helps to identify dominant values, sparsity, and data quality patterns quickly.
What the Widget Analyzes
-
Profiling dimension: Column value distribution
-
Level of analysis: Column-level
-
Calculation basis:
-
Value counts are calculated based on the number of records for each distinct value in the selected column
-
Percentages represent the proportion of records for each value relative to the total record count of the column
-
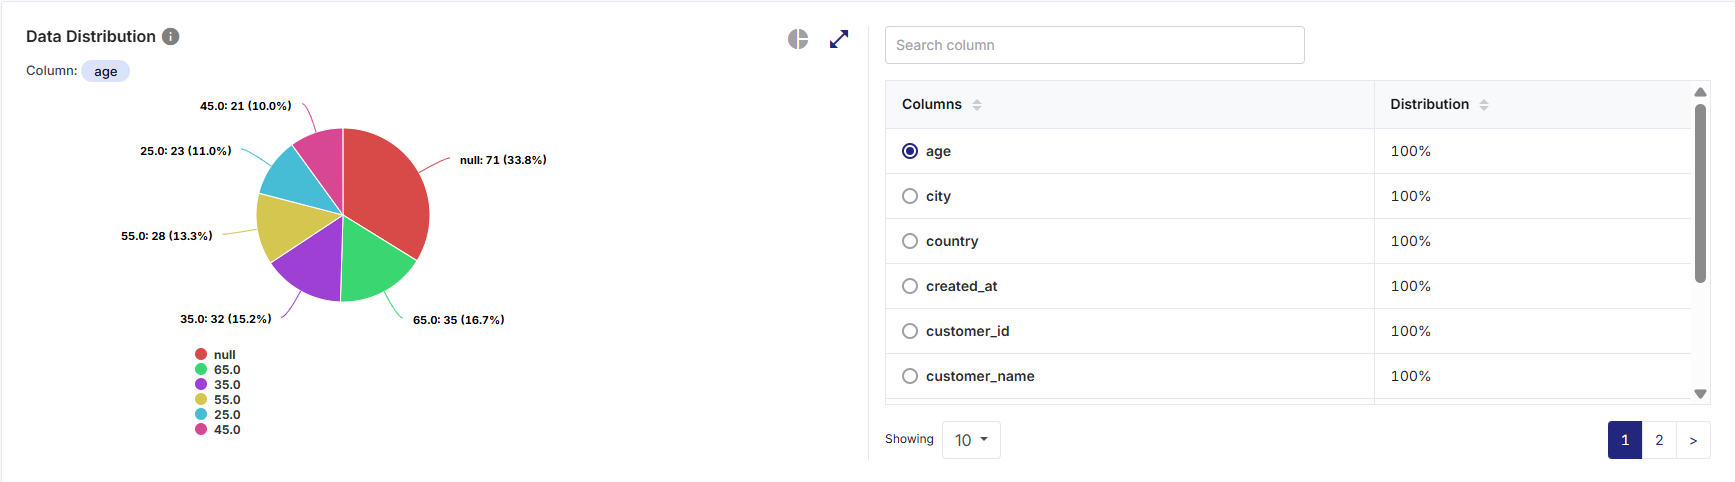
What the Widget Shows
-
Distribution of distinct values for the selected column.
-
Count and percentage contribution of each value.
-
Explicit visibility of null values as a separate category, where applicable.
-
A column selector and column list that allows switching the distribution view across different columns.
How to Read This Widget
-
Each visual element (slice or bar) represents a distinct value within the selected column.
-
The size or length of each segment indicates the relative frequency of that value.
-
Percentages are based on record-level distribution, not column counts.
Column Selection
-
The currently selected column name is displayed next to the Column label at the top left corner of the widget.
-
Selecting a different column from the right pane updates the chart and distribution details dynamically.
-
Only one column can be analyzed at a time in this widget.
Available Views
The widget supports multiple visualization formats in various chart or graph views on the left pane.
On the top-right corner of the visualization pane, use the:
-
Chart or graph view icon to switch between available view types
-
Expand icon to visualize a larger view for detailed analysis
-
Collapse icon to restore the widget to its default size

Note:
Hovering over any chart element displays a tooltip showing Name, Value (Record count), and Percentage of total records. These tooltips provide precise numeric insight without cluttering the chart. All interactions are read-only and do not alter the dataset.
| Value Type | Description |
|---|---|
|
Bar View |
This view displays each distinct value as a horizontal bar and the bar length represents the number of records for the value. Hovering over a bar displays a tooltip with value, count, and percentage. |
|
Pie View |
This view displays each distinct value as a slice of the pie and the slice size represents the percentage of records for that value. Null values are displayed as a separate slice when present. |
Supporting Panes
The widget includes a Data Distribution tabular summary pane on the right, always visible alongside the visualization pane on the left, providing detailed column-level context. It displays:
-
A list of all available Columns in the dataset.
-
A Distribution indicator (100%) for each column, indicating that the column is eligible for distribution analysis.
Pane Interactions
-
Provide a column name in the Search column list box to filter columns in the table and quickly locate a specific column by name.
-
Click the download icon to export the result as PDF, CSV, or XLSX file. You can either download a consolidated file or individual widgets.
-
Download individual widgets to analyze specific visualizations in detail and gain deeper insights. Files are saved using a standard naming format by default, which you can rename locally after download:
<Data Profiler Results Widget name>_<Source Table name>.<pdf | csv | xlsx>
Example: DataDistribution_bronzepatientvisitdetails.csv
-
For consolidated Excel downloads, each widget is exported to a separate worksheet. For example, three widgets are saved as three sheets within a single Excel file.
-
-
Select a column radio button to update the distribution chart on the left pane to reflect the selected column.
-
Click on the column headers to sort columns in ascending or descending order.
-
Scroll to access the additional columns when the list exceeds visible space.
Null Value Representation
-
Null values are explicitly shown in both chart and tooltip views.
-
Nulls are treated as a separate category and included in percentage calculations.
-
This helps users quickly assess missing or incomplete data for the selected column.
How to Interpret the Results
-
A single dominant value may indicate low variability or categorical skew.
-
Presence of null values highlights data completeness issues.
-
Balanced distributions suggest healthy categorical diversity.
-
Smaller bars indicate less frequent values or sparse data entries.
-
Extremely sparse values may require normalization or validation.
When to Use This Widget
-
To analyze value-level distribution for categorical or identifier columns.
-
To identify dominant, missing, or rare values within a column.
-
To validate data completeness and consistency.
-
To support downstream data quality rule definition (for example, null checks or domain checks).
 Recommended Topics |
What's next?Data Completeness |